
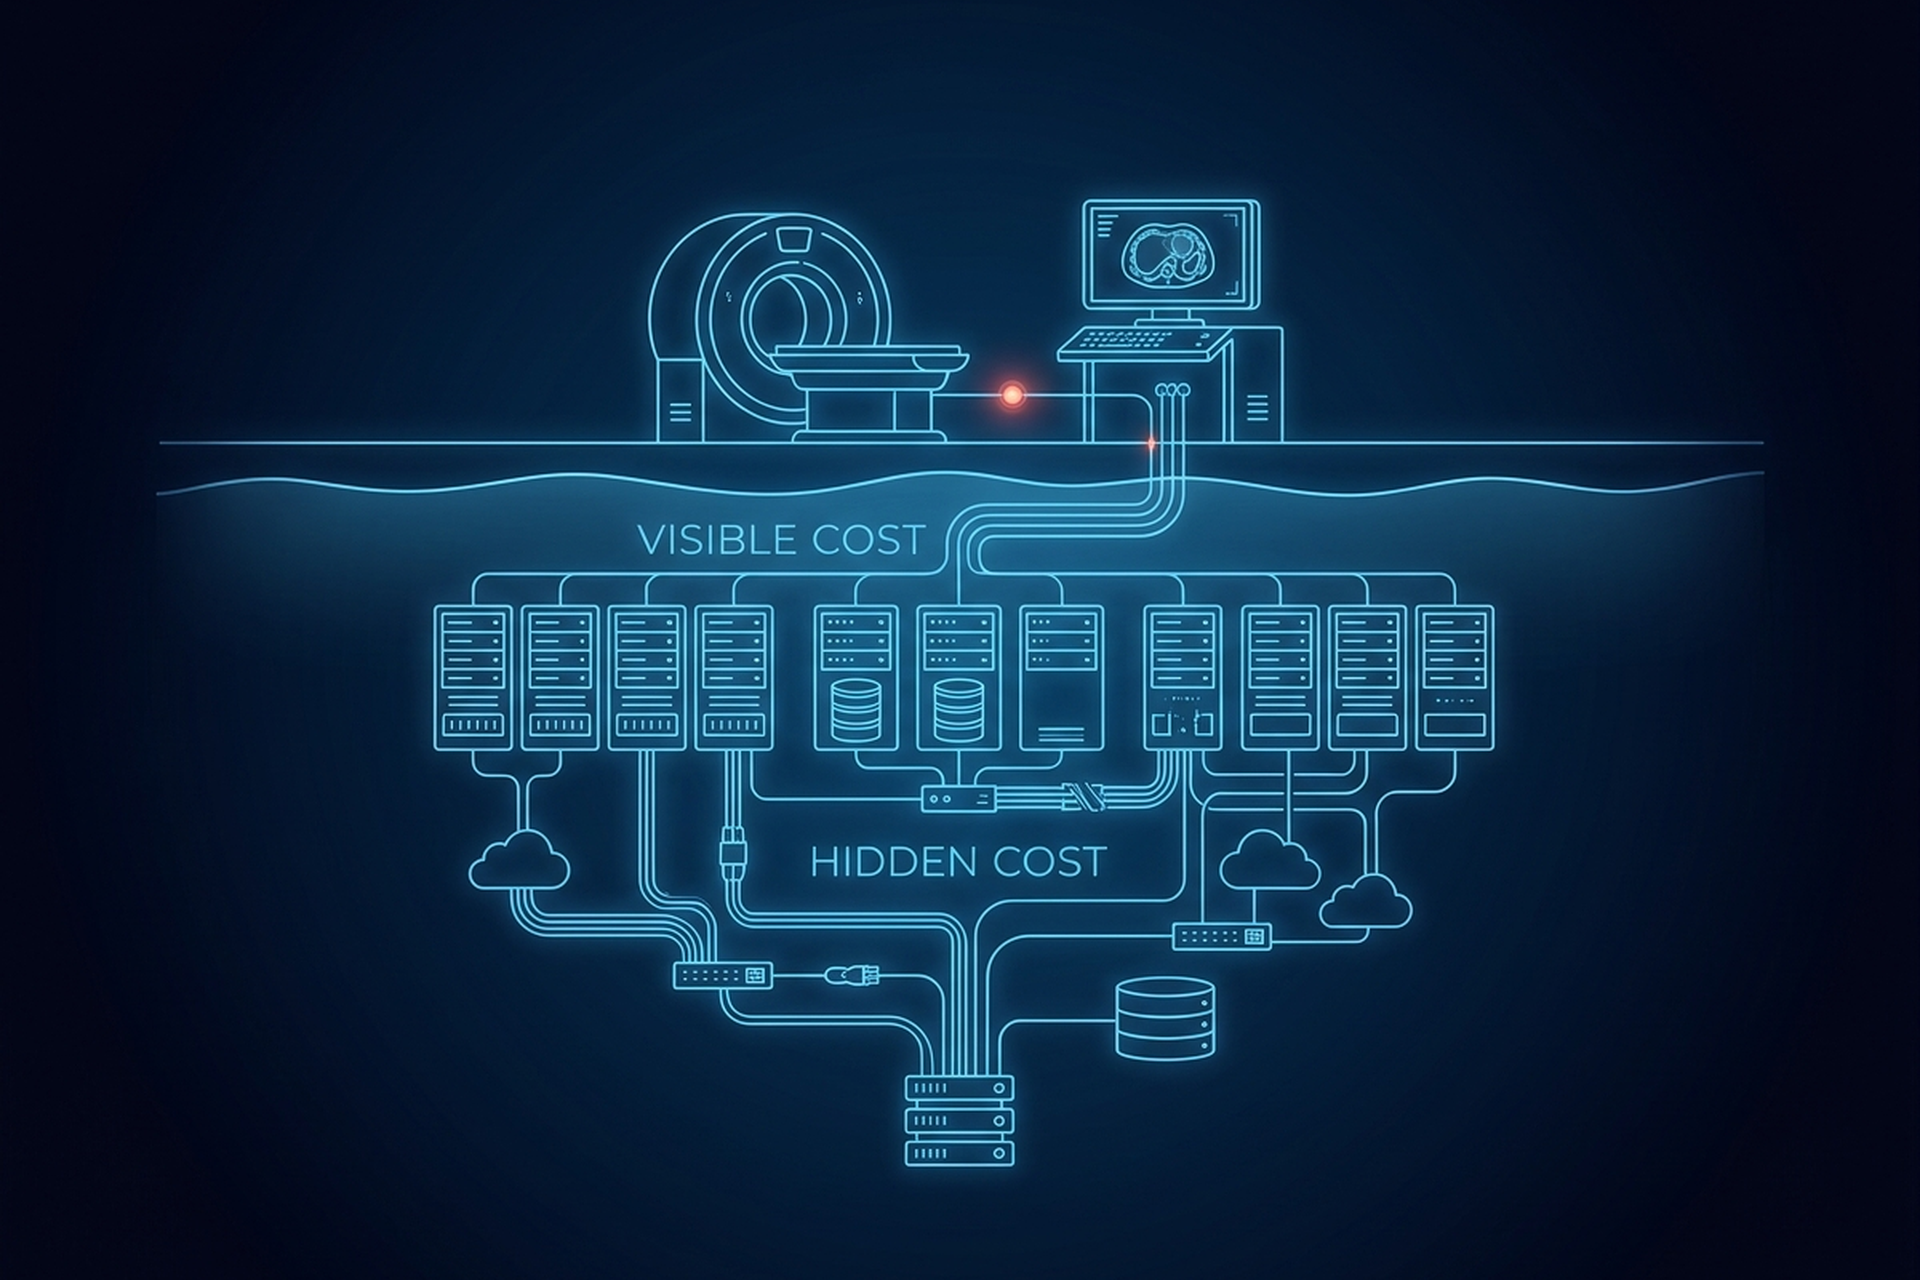
Ask a buyer what a PACS costs and the number that comes back is almost always the license or subscription line: the figure on the proposal, negotiated before anyone signs. That number is real. It is also, over the life of a deployment, rarely the largest one.
The costs that actually surprise a buyer eighteen months in sit somewhere else. They sit in integration labor a statement of work underpriced, and in storage that keeps growing long after the sales call ended. They sit in a support contract renewed at a figure nobody budgeted for, and in the internal hours a product team spent that never showed up on an invoice. A PACS cost conversation that stops at the license line is answering the wrong question.
This is not a pricing page: EBM publishes no pricing, and nothing here is a quote. It is a framework: the line items a product or engineering leader at an OEM or VAR should itemize before signing anything, what actually drives each one, and the question that surfaces it during evaluation. A related piece on this site covers how small radiology practices should compare cloud PACS vendors on overall cost shape. This one stays a level below that: the individual line items, in roughly the order they show up over a deployment’s life.
Why the License Line Isn’t the Real PACS Cost
A PACS acquisition budget splits into two pots that behave differently: capital, the cost to purchase and implement the system, and recurrent, the cost to keep it running afterward. A traditional purchase concentrates cost in the capital pot up front. A subscription or per-study model, sometimes called an application service provider arrangement, moves that same spending into the recurrent pot instead, spread across the life of the system.
The acquisition model determines which pot a cost lands in, not whether the cost exists. A subscription number that looks lower than a competing purchase price is not automatically cheaper. It may just be the same total, deferred. The question worth asking a vendor directly is what the quoted figure actually includes: support, upgrades, and storage at current volume, or only the base license with everything else billed separately later.
Implementation and Integration Labor
A statement of work often lists integration as a single line, priced like one task. It isn’t. Connecting modalities, the RIS, and the EHR is really three separate integrations. Modality connectivity runs on DICOM, while the RIS and EHR interfaces typically run on HL7 v2, and each of the three can slip the schedule on its own.
Interfacing a PACS, RIS, and hospital information system is not a line item that comes free, particularly when separate vendors sit on each side of the connection. Every additional modality connection, every RIS interface, and every EHR handoff is its own scoped task with its own professional services cost. A proposal that bundles “integration” into one number without naming what it covers has not actually scoped the work.
The question that surfaces this early: ask a vendor to itemize integration by connection, modality by modality and system by system, rather than as a single implementation fee. If they cannot, the number was estimated, not scoped.
Hardware, When It’s Part of the Deal
Not every PACS deployment carries a hardware line, but when it does, the cheaper option is not always the cheaper choice over time. A 2025 total cost of ownership study of remote radiology workstations found that a commercial-grade display cut upfront equipment cost by roughly half against a high-end 6MP diagnostic display. The commercial display’s ongoing quality control and calibration work, mostly radiologist and IT staff time, then ran its yearly maintenance cost to several times the diagnostic-grade figure. Against a mid-level 8MP diagnostic display, that study’s own crossover analysis puts break-even at 5.2 years when quality control on the commercial display runs monthly, and at 1.4 years when it runs weekly.
The pattern generalizes past displays. A cheaper unit that shifts cost into recurring labor is not automatically the lower-TCO choice, and the shift is easy to miss if a comparison only looks at the purchase price line. The question to ask: what is the annual labor cost of keeping this specific piece of hardware in compliance, not just its warranty terms.
Storage Growth Across the Retention Window
Storage is real money over a deployment’s life, and sizing medical imaging storage for real study volume is the piece on this site that walks through what drives a study’s byte count. What belongs here is the TCO framing. A quote priced on today’s volume is a snapshot, not a forecast, because the archive keeps billing for as long as the retention window runs.
That window is generally governed by state law rather than by a vendor’s default, and federal rules sit on top of it in places. Mammography is the clearest case: under the MQSA recordkeeping rule, a facility keeps original mammograms and reports for at least five years, or at least ten if the patient has no further mammograms there. State or local law can extend that, and the longest applicable period is the one the storage line has to be sized against.
What makes this line hard to forecast is that the charges stack. Annual study volume grows, and every year of the retention window keeps paying for the years before it, so the archive bills on a cumulative footprint rather than a yearly one. Egress and retrieval from a colder tier ride on top of both, and they are the charge most often absent from a storage quote entirely.
The question worth asking is not “how much storage do we need today.” It is what the price per unit of storage does as the archive grows, and whether older studies move to cheaper storage automatically or keep billing at the active rate indefinitely.
Support and Maintenance Contracts
A 2008 paper on PACS budgeting in the Biomedical Imaging and Intervention Journal puts a number on this one. It found that a PACS or RIS service contract, covering hardware support, software updates and vendor response time, commonly ran 10% to 20% of the system’s capital cost every year. That is not a one-time fee. It recurs for as long as the system runs, and it is frequently the single largest recurring line once the initial implementation is behind a buyer.
What drives the percentage within that range is coverage. The variables are whether support runs around the clock with proactive monitoring or business hours only, what the contracted response time actually is, and whether a field engineer is available on site or only remotely. The question to ask a vendor is not whether they offer support. It is what the contracted response time is in writing, and what portion of the annual fee that specific coverage level actually costs.
Training and the Internal Time Nobody Books
Every PACS deployment costs internal staff time that rarely appears on an invoice: release time for project meetings, staff attending training courses, overtime for upgrades scheduled outside business hours to avoid disrupting a live department. The same 2008 budgeting paper treats this as its own category, change management, distinct from the technology spend it sits alongside.
That time is real cost even when no check gets written for it. A product team that books only the vendor’s invoice against a deployment, and not its own staff hours, is understating the true cost of that deployment, sometimes by a wide margin. It will make the same underestimate on the next one unless the internal time gets tracked the first time.
The Cost of Downtime
No PACS deployment plans for its own downtime, and nearly every one eventually has some. A 33-month analysis of hospital IT system outages found care delivery disrupted for an average of 49 hours a year. More than half of that total fell during normal business hours rather than overnight, when the disruption is cheapest to absorb.
That distribution is the part worth pricing out before signing, not after the first outage. During an outage the modality usually keeps acquiring and holds the study in local storage: what stops is C-STORE receipt into the archive, query/retrieve of prior studies, and reporting. So the number to work out is what a study stuck outside the archive costs a practice or a partner’s customer, for each of those 49 hours that lands in active reading time. A vendor’s uptime percentage on a spec sheet answers a different question than this one.
Migration at Exit
The last line item sits at the end of a deployment’s life, which is exactly why it is the easiest one to leave off a year-one comparison. Buying storage that outlives the PACS in front of it covers what makes a migration technically hard: private tags, presentation states, structured reports and non-DICOM objects a naive export can drop. What belongs in a TCO worksheet is the price of dealing with that.
An exit carries three cost lines, and none of them usually appear on a year-one proposal. The first is the export itself, billed as professional services by the study or by the terabyte. The second is the validation pass that proves nothing was dropped, which is buyer-side labor almost every time. The third is the overlap period where both archives run, and both bill, until the last study is verified in its new home.
An exit cost exists, it is rarely quoted at signing, and a buyer who has not asked about it is pricing only the entry to a relationship, not the leaving of it.
The Line Items Worth Itemizing Before You Sign
Eight documents, requested directly from any vendor, do more to surface the real number than any proposal will on its own:
- A written inclusions list for the quoted license or subscription, naming what is billed separately.
- A per-connection integration price sheet, one line per modality, RIS and EHR interface.
- For any hardware in the deal, the annual maintenance hours by role, not the warranty term.
- The storage rate card at two and five times today’s archive, with the tiering and retrieval rules on it.
- The support clause itself, showing the contracted response time and the fee attached to that coverage tier.
- A buyer-side staffing estimate in hours per role, covering meetings, training and off-hours upgrade work.
- The vendor’s own outage history, broken out by hour of day.
- The exit clause, with the export price, the format and the timeline written into it.
What This Means for a Buyer
None of these eight documents replace the broader framework for evaluating cloud PACS vendors an OEM or VAR should run before choosing a platform to build on. They sharpen one part of it. That is the part where a buyer stops comparing a single number on a proposal and starts pricing the actual multi-year shape of a deployment, line by line, before that shape becomes a surprise.
A complete PACS platform has enough moving subsystems that the honest PACS cost of running one is never going to be a single figure a vendor prints on a homepage. It is a worksheet a buyer builds themselves, using the list above, and the vendor who produces all eight is telling a buyer something true about the rest of the relationship.
For a partner building on EBM Fabric™, the same worksheet applies. EBM mAIn PACS® ships across more than one deployment surface: EPS Pi, the edge PACS appliance that carries DICOM server, storage, routing, worklist and reporting, plus a Mac mini option for centralized deployments. EBM’s own stated typical deployment time is about a day, which is a claim about time to bring the system online, not a price.
What the line items above total for a specific partner, at a specific volume, over a specific number of years is a conversation to have directly, using this framework. It is not a number this page is in a position to give.